
Interactive Notebook Activities - Picture Graphs and Bar Graphs {2.MD.10}


- PDF
Also included in
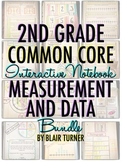 2nd Grade Measurement / Graphing This set of Interactive Notebook Activities will keep your second grade students engaged and excited about math this year! This set focuses is aligned with Common Core standards in the Measurement and Data domain.*****************************************************Price $22.60Original Price $28.25Save $5.65
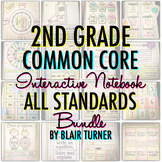 2nd Grade Math Interactive Notebooks for ALL STANDARDSThis mega-bundle includes my interactive notebook activities for EACH AND EVERY 2nd Grade Common Core math standard!Each standard has an I Can Statement and Vocabulary flapbook with definitions, along with a collection of flippable, foldable, andPrice $54.25Original Price $77.50Save $23.25
Description
2nd Grade Pictographs and Bar Graphs
CCSS.Math.Content.2.MD.D.10 Draw a picture graph and a bar graph (with single-unit scale) to represent a data set with up to four categories. Solve simple put-together, take-apart, and compare problems1 using information presented in a bar graph.
****************************************************************************
Included:
-3 pages of directions with photographs
-I Can Statement and Vocabulary Flap Book with Definitions for Each Term
-Make a Picture Graph
-Make a Bar Graph
-Word Problem Flapbooks for Picture Graph and Bar Graph
-Sports Ball Graphing - create 2 graphs and generate word problems
This is a hands-on way for kids to get involved in learning graphing concepts aligned with 2.MD.10!
****************************************************************************
© Blair Turner, One Lesson at a Time, Inc.
Materials are intended for personal use in one classroom only. For use in multiple classrooms, please help support my work by purchasing additional licenses - thank you!
