TPT
Total:
$0.00

Graphing Quadratics and Key Features of Quadratic Functions Worksheet Algebra 1

Rated 4.88 out of 5, based on 8 reviews
4.9 (8 ratings)
;
mrscasiasmath
2.6k Followers
Grade Levels
8th - 11th
Standards
Formats Included
  • PDF
Pages
4 pages
$1.50
$1.50
Share this resource
Report this resource to TPT
mrscasiasmath
2.6k Followers

What educators are saying

Guided notes are always perfect for my class with varied levels of learners. Thank you for creating this!
This worksheet was the perfect practice to introducing graphing quadratic functions and identifying key features!

Description

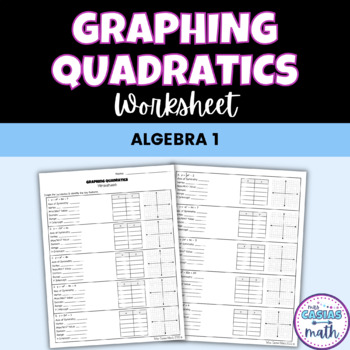
This Algebra 1 worksheet is great graphing quadratics and identifying key features and characteristics of quadratic functions practice for students. In addition to filling out a table and graphing the parabola, students also identify key features of the quadratic function including the axis of symmetry, vertex, minimum/maximum value, y-intercept and domain & range. There are 10 problems included that provide a variety of practice for students.

This product includes

     ● Worksheet PDF (two pages)

     ● Answer Key

This activity aligns well with Algebra 1 TEKS A.6A and A.7A. 

Related & Similar Resources: 

     ★ Quadratic Function Transformations Math Mystery Picture

     ★ Key Features of Quadratic Graphs Mystery Picture

     ★ Quadratic Function Guided Notes Bundle

Be sure to follow my store for updates on new products >> CLICK HERE

Remember to leave feedback to receive TPT credits for future purchases!

Let’s connect! Follow me on INSTAGRAM or email me at mrscasiasmath@gmail.com ☺

Total Pages
4 pages
Answer Key
Included
Teaching Duration
N/A
Report this resource to TPT
Reported resources will be reviewed by our team. Report this resource to let us know if this resource violates TPT’s content guidelines.

Standards

to see state-specific standards (only available in the US).
For a function that models a relationship between two quantities, interpret key features of graphs and tables in terms of the quantities, and sketch graphs showing key features given a verbal description of the relationship.
Relate the domain of a function to its graph and, where applicable, to the quantitative relationship it describes. For example, if the function 𝘩(𝘯) gives the number of person-hours it takes to assemble 𝘯 engines in a factory, then the positive integers would be an appropriate domain for the function.
Graph linear and quadratic functions and show intercepts, maxima, and minima.

Reviews

Questions & Answers

2.6k Followers