Exponential Regression Stock Market Project
Be-Well Teaching Resources
10 Followers
Grade Levels
9th - 12th
Subjects
Resource Type
Standards
CCSSHSA-CED.A.1
CCSSHSA-CED.A.2
CCSSHSF-IF.B.5
CCSSHSF-LE.A.1
CCSSHSF-LE.A.1a
Formats Included
- PDF
Pages
3 pages
Be-Well Teaching Resources
10 Followers
Description
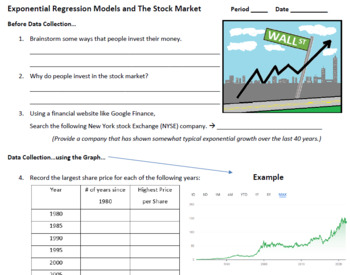
Using free online stock graphs, students will explore exponential growth for various companies. An exponential regression model will allow students to make predictions and find out how much money they would make off of a stock at retirement age. This mutiple-day activity is rich with Algebra 2 and Precalculus topics!
Total Pages
3 pages
Answer Key
Does not apply
Teaching Duration
2 hours
Report this resource to TPT
Reported resources will be reviewed by our team. Report this resource to let us know if this resource violates TPT’s content guidelines.
Standards
to see state-specific standards (only available in the US).
CCSSHSA-CED.A.1
Create equations and inequalities in one variable and use them to solve problems.
CCSSHSA-CED.A.2
Create equations in two or more variables to represent relationships between quantities; graph equations on coordinate axes with labels and scales.
CCSSHSF-IF.B.5
Relate the domain of a function to its graph and, where applicable, to the quantitative relationship it describes. For example, if the function 𝘩(𝘯) gives the number of person-hours it takes to assemble 𝘯 engines in a factory, then the positive integers would be an appropriate domain for the function.
CCSSHSF-LE.A.1
Distinguish between situations that can be modeled with linear functions and with exponential functions.
CCSSHSF-LE.A.1a
Prove that linear functions grow by equal differences over equal intervals, and that exponential functions grow by equal factors over equal intervals.


