Data Analysis: Shape, Center, and Spread Notes and Worksheets
Lindsay Bowden - Secondary Math
4k Followers
Grade Levels
8th - 10th, Homeschool
Subjects
Resource Type
Standards
CCSSHSS-ID.A.2
CCSSHSS-ID.A.3
Formats Included
- Zip
Pages
4 + answer keys
Lindsay Bowden - Secondary Math
4k Followers
What educators are saying
I loved this resource and bought others that go with it. I have used them for lesson planning as well as assessment making.
This helped me because skewed data is a new piece of information that was not in my curriculum last year.
Also included in
- This is a complete statistics unit for an Algebra 1 course. All assessments (quizzes, study guide, and test) are editable to fit your needs. This unit is included in my Algebra 1 Curriculum.*Note: This unit is best suited for on-level or lower-level/special education math classes. Supplements will mPrice $49.00Original Price $49.00
- Get a complete Algebra 1 Notes and Worksheets Bundle with units on proofs, polynomials, linear functions and inequalities, word problems, slopes, relations, quadratics, geometric sequences, plots, and more! These ready-to-use algebra 1 resources include notes and worksheets for an entire year.*No VPrice $121.60Original Price $152.00Save $30.40
Description
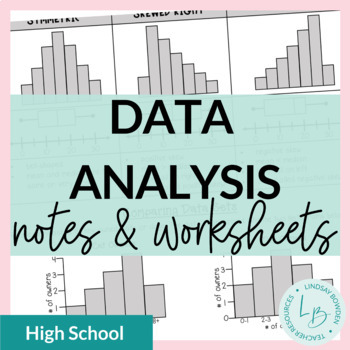
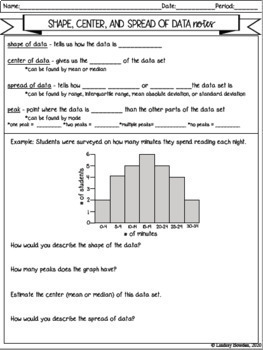
These data analysis notes and worksheets compare two data sets with regards to shape, center, and spread of data.
They cover:
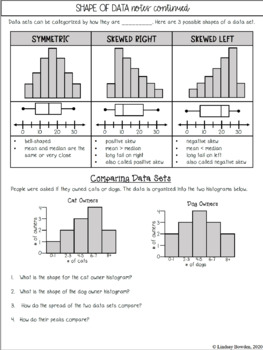
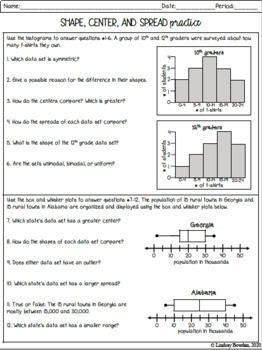
- comparing data of two sets using histograms, dot plots, box and whisker plots,and stem and leaf plots
- shape (symmetrical, skewed right, skewed left)
- center (mean, median)
- peaks (mode)
- spread
- analyzing what these factors mean in context of the problem
4 pages + all answer keys
You may also like:
- Mean, Median, and Mode Notes & Worksheets
- Box and Whisker Plots Notes & Worksheets
- Histograms Notes & Worksheets
Terms of Use:
This product should only be used by the teacher who purchased it. This product is not to be shared with other teachers. Please buy the correct number of licenses if this is to be used by more than one teacher.
Did you know?
You can receive TPT store credits to use on future purchases by leaving feedback on products you buy! Just click on "My Purchases" under "Buy"!
Connect with me!
Total Pages
4 + answer keys
Answer Key
Included
Teaching Duration
1 hour
Report this resource to TPT
Reported resources will be reviewed by our team. Report this resource to let us know if this resource violates TPT’s content guidelines.
Standards
to see state-specific standards (only available in the US).
CCSSHSS-ID.A.2
Use statistics appropriate to the shape of the data distribution to compare center (median, mean) and spread (interquartile range, standard deviation) of two or more different data sets.
CCSSHSS-ID.A.3
Interpret differences in shape, center, and spread in the context of the data sets, accounting for possible effects of extreme data points (outliers).


