TPT
Total:
$0.00

Data Analysis: Human Population Increase & Plastic Pollution CER Open Response

Rated 5 out of 5, based on 6 reviews
5.0 (6 ratings)
;
Growing Curiosity
42 Followers
Grade Levels
4th - 12th, Higher Education, Adult Education, Homeschool, Staff
Resource Type
Standards
Formats Included
  • Google Forms™
$1.95
$1.95
Share this resource
Report this resource to TPT
Growing Curiosity
42 Followers
Made for Google Drive™
This resource can be used by students on Google Drive or Google Classroom. To access this resource, you’ll need to allow TPT to add it to your Google Drive. See our FAQ and Privacy Policy for more information.

Description

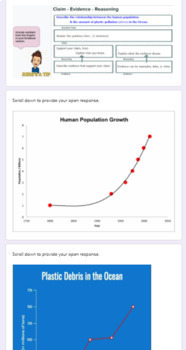
Students identify the pattern between rising human population & increasing plastic pollution rates. Using line graphs, students are guided in describing the relationship between two data sets to describe the negative human impact on ecosystems.

A claim - evidence- reasoning (CER) graphic organizer is provided to guide students' writing. Encouraged to incorporate evidence, students are also prompted to think about the importance of each element of the CER writing tool. This activity is chunked and guides students to reflect on their thinking.

This Google Form can be shared via Google Classroom, by a link, or printed as a low-tech activity. It is also good for an emergency sub plan.

Like this data analysis activity? Check out other items in my store! =)

Total Pages
Answer Key
N/A
Teaching Duration
N/A
Report this resource to TPT
Reported resources will be reviewed by our team. Report this resource to let us know if this resource violates TPT’s content guidelines.

Standards

to see state-specific standards (only available in the US).
Make a line plot to display a data set of measurements in fractions of a unit (1/2, 1/4, 1/8). Use operations on fractions for this grade to solve problems involving information presented in line plots. For example, given different measurements of liquid in identical beakers, find the amount of liquid each beaker would contain if the total amount in all the beakers were redistributed equally.
Understand that statistics can be used to gain information about a population by examining a sample of the population; generalizations about a population from a sample are valid only if the sample is representative of that population. Understand that random sampling tends to produce representative samples and support valid inferences.
Reason abstractly and quantitatively. Mathematically proficient students make sense of quantities and their relationships in problem situations. They bring two complementary abilities to bear on problems involving quantitative relationships: the ability to decontextualize-to abstract a given situation and represent it symbolically and manipulate the representing symbols as if they have a life of their own, without necessarily attending to their referents-and the ability to contextualize, to pause as needed during the manipulation process in order to probe into the referents for the symbols involved. Quantitative reasoning entails habits of creating a coherent representation of the problem at hand; considering the units involved; attending to the meaning of quantities, not just how to compute them; and knowing and flexibly using different properties of operations and objects.
Construct viable arguments and critique the reasoning of others. Mathematically proficient students understand and use stated assumptions, definitions, and previously established results in constructing arguments. They make conjectures and build a logical progression of statements to explore the truth of their conjectures. They are able to analyze situations by breaking them into cases, and can recognize and use counterexamples. They justify their conclusions, communicate them to others, and respond to the arguments of others. They reason inductively about data, making plausible arguments that take into account the context from which the data arose. Mathematically proficient students are also able to compare the effectiveness of two plausible arguments, distinguish correct logic or reasoning from that which is flawed, and-if there is a flaw in an argument-explain what it is. Elementary students can construct arguments using concrete referents such as objects, drawings, diagrams, and actions. Such arguments can make sense and be correct, even though they are not generalized or made formal until later grades. Later, students learn to determine domains to which an argument applies. Students at all grades can listen or read the arguments of others, decide whether they make sense, and ask useful questions to clarify or improve the arguments.
Model with mathematics. Mathematically proficient students can apply the mathematics they know to solve problems arising in everyday life, society, and the workplace. In early grades, this might be as simple as writing an addition equation to describe a situation. In middle grades, a student might apply proportional reasoning to plan a school event or analyze a problem in the community. By high school, a student might use geometry to solve a design problem or use a function to describe how one quantity of interest depends on another. Mathematically proficient students who can apply what they know are comfortable making assumptions and approximations to simplify a complicated situation, realizing that these may need revision later. They are able to identify important quantities in a practical situation and map their relationships using such tools as diagrams, two-way tables, graphs, flowcharts and formulas. They can analyze those relationships mathematically to draw conclusions. They routinely interpret their mathematical results in the context of the situation and reflect on whether the results make sense, possibly improving the model if it has not served its purpose.

Reviews

Questions & Answers

42 Followers