Climate Change Reading & Worksheet Extreme Weather Claim Evidence Reasoning CER
- Zip
Also included in
- Looking for a complete, standalone year-long curriculum for integrated NGSS Physics, Energy, Waves, Astronomy, Earth’s History, Science and Engineering Practices, Crosscutting Concepts, and Evolution? Look no further than this student-centered, inquiry-based, hands-on bundle! Designed to align withPrice $205.00Original Price $366.00Save $161.00
- This resource is packed with easy to use, easy to grade, no prep, scientific current events, using the NGSS Science and Engineering practice of Engaging in Argument from Evidence. Students learn about a variety of science topics through a C.E.R. (Claim Evidence Reasoning) graphic organizers. This isPrice $47.00Original Price $91.75Save $44.75
- -Students learn about a variety of current events regarding Human Impacts on Earth through a C.E.R. (Claim Evidence Reasoning) graphic organizer. This is great for scaffolding content, sub plan, independent work, homework, review or distance learning. What Students do:The students figure out what thPrice $24.00Original Price $45.50Save $21.50
Description
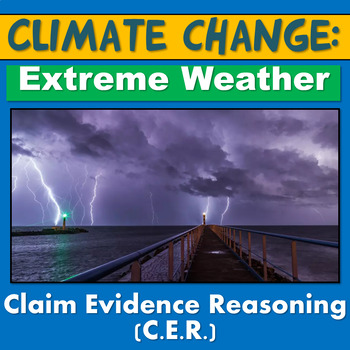
This product helps students understand the science of Climate Change and the possible impact it has on extreme weather events. It was written in 2015 and considering the intensity of the 2017 hurricane season the article is very prophetic. Students will use evidence in the article that climate change has and will continue to contribute to more intense storms, snow, rain, droughts and other weather events.
Claim Evidence Reasoning or C.E.R. charts are great for getting your students to explain phenomena in a meaningful way and it allows you as the instructor to adequately assess their understanding of concepts. The students figure out what the "Claim" is in the article, they then use data that supports the claim in the "Evidence" section, draw visual evidence and then explain why the evidence supports the claim in the "Reasoning " section.
You get a CER graphic organizer, the key, the article, vocabulary words with definitions and the link to the website which is at the beginning of the article. This can be used as a current event and/or relating to weather and climate change.
It's now Google Ready for Distance Learning!!!
Includes the following vocabulary:
Carbon dioxide
Climate
Climate change
Computer model
Fossil fuels
Global warming
Greenhouse gas
Greenhouse effect
Industrial Revolution
Simulate
Weather
It includes the following NGSS standards:
DISCIPLINARY CORE IDEAS (DCI)
ESS2.C: The Roles of Water in Earth’s Surface Processes
ESS2.D: Weather and Climate
ESS3.D: Global Climate Change
ESS1.B: Earth and the Solar System
ESS2.A: Earth Materials and Systems
ESS3.D: Global Climate Change
CROSSCUTTING CONCEPTS (CCC)
Cause and Effect
Stability and Change
SCIENCE AND ENGINEERING PRACTICES (SEP)
Analyzing and Interpreting Data
Stability and Change
It includes the following Common Core standards:
RST.11-12.1 - Cite specific textual evidence to support analysis of science and technical texts, attending to important distinctions the author makes and to any gaps or inconsistencies in the account. (HS-ESS3-5)
RST.11-12.2 - Determine the central ideas or conclusions of a text; summarize complex concepts, processes, or information presented in a text by paraphrasing them in simpler but still accurate terms. (HS-ESS3-5)
RST.6-8.1 - Cite specific textual evidence to support analysis of science and technical texts. (MS-ESS2-5), (MS-ESS3-5)
RST.6-8.9 - Compare and contrast the information gained from experiments, simulations, video, or multimedia sources with that gained from reading a text on the same topic. (MS-ESS2-5)
Thank you for taking a look!
Please follow me on TpT for new products and check me out on Instagram for my products in action!
https://www.instagram.com/williams_hands_on_science/
Take a look at some other products in my store:
Elements, Atoms, Compounds and Molecules Card Sort
Flipping the Classroom Periodic Table Frayer Models
Physical Science Scaffolded Notes
NGSS Speed, Time, Distance, Acceleration and Graphing Worksheets
Physics Speed, Time and Distance Problems
STEM Paper Airplane Competition
Physical Science Scaffolded/Guided Notes for a Year + 8 PREZIS
NGSS Kinetic and Potential Energy Card sort


