Area and Perimeter Worksheets Line Plot Measurement Activities Math Review 3rd
- Zip
- Google Apps™

Also included in
- Are you looking for 3rd-grade math activities to review all the standards? Whether you are teaching 4th grade and want to review 3rd grade standards during back to school or teaching 3rd grade and want to use these all year, these rigorous, high-interest activities will have your students criticallyPrice $15.00Original Price $20.00Save $5.00
Description
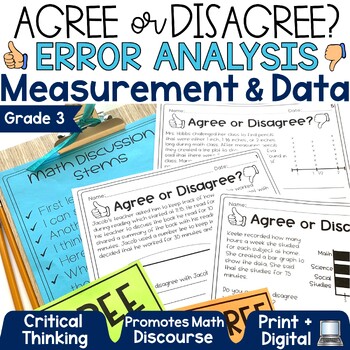
Looking for measurement and data math activities to help your third-grade students get a deeper understanding of important standards like elapsed time, graphing, line plots, and area and perimeter? These critical thinking error analysis math activities are just what you need to practice tricky concepts! Your students will love using the agree and disagree cards to critique the work of others and defend their mathematical thinking!
These error analysis math tasks were designed to support and enhance any math program you use!
These mathematical problems reinforce students' reading, writing, and debating skills. Included are agree/disagree cards, as well as math discussion stems and questions to help students engage in meaningful discourse in whole group, small group, or partner settings focused around these problems.
Problem solving tasks are based on elapsed time, measurement, graphing, line plots, area and perimeter.
Use as test prep, bell ringers, exit tickets, assessments, and learning activities during your math block.
Included are 17 problems in four different formats. This means that the same 17 problems are presented on worksheets, task cards, Google slides, and PowerPoint slides. Use all of one format, or mix it up to meet the needs of your students.
SAVE BIG by purchasing the: Error Analysis Grade 3 Bundle
This product includes both print and digital versions.
CONTENTS:
✓Directions and Link for use in Google Classroom™
✓17 Measurement and Data Critiquing Word Problems in 3 Formats:
- Activity Sheet Format
- Task Card Format
- Whole Class PowerPoint Format (perfect to use as bell ringers)
✓Agree/Disagree Student Cards (2 sizes included)
✓Student Discussion Stems and Questions
✓Answer Keys
✓Teacher Suggestions
Suggested Classroom Use:
✓Math centers or stations
✓Small group work and partnership activities
✓Formal or informal assessments
✓Independent practice/Reinforcement
✓Homework or Classwork Review
✓Test Prep
✓Whole Class Bell Ringers/ Morning Work
Please view the preview for a more detailed look at all this product offers.
Teacher Approved!
⭐️⭐️⭐️⭐️⭐️
"My students really enjoyed this."
⭐️⭐️⭐️⭐️⭐️
"Looks fantastic! I always need more error analysis practice ideas and this is perfect. I'm looking forward to utilizing this with my students!"
You will also love:
- Math Text Me Word Problems Grade 3
- Differentiated Tic Tac Math Problem Solving Games
- Growth Mindset Posters
- Math Practices Posters
- Math Alphabet
Follow me HERE for notifications of new products and sales. Remember new products are always 50% off the first 24 hours!
Questions? Email me directly HERE


