Analyzing Ecosystem Graphs & Data Analysis Resource Availability MS LS2-1
- PDF
- Google Apps™

What educators are saying
Also included in
- Do you teach 6th-grade science in Indiana? This is a full-year bundle for the Indiana Science Standards for 6th grade. This bundle covers all the 6th-grade standards and gives your science activities for the year! Aligns with 2023 Indiana Academic Science Standards. Benefits of this Bundle:phenomenaPrice $104.76Original Price $130.95Save $26.19
- This NGSS Middle School Science Bundle is my biggest bundle! It includes all my middle school science units, Bell Ringers, Jeopardy-style games, Assessments, and Informational Text Science Units for Middle School. It addresses all the NGSS standards for 6th, 7th, and 8th Grade NGSS science. Save whePrice $489.55Original Price $699.35Save $209.80
- Do you want to save time in planning for middle school science? This Middle School Science Curriculum Bundle addresses all the DCIs for Middle School NGSS. Complete units with phenomena-based 5E Science Lessons for 6th, 7th, and 8th Grade.Save more than 30% by purchasing this bundle! ❤️ Get back toPrice $304.32Original Price $434.75Save $130.43
Description
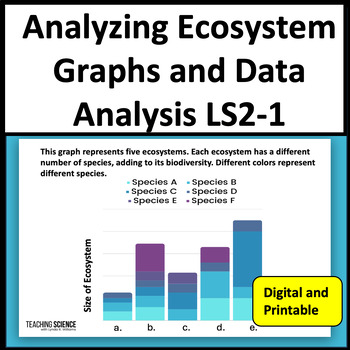
Do your students need practice with analyzing ecosystem graphs? These science graph worksheets include data analysis on resource availability in ecosystems. Students will use critical thinking to answer the questions. Great for Science TEST Prep! This set includes 20 pages of science graphs and diagrams with questions. You will get a printable PDF with a link to Google Slides. Great for CAST and STAR Test Prep.
This Ecosystem Graph Practice Unit Includes:
•20 printable pages of charts and diagrams with questions in Google and Printable PDF
•Answer Keys
•Three simplified graphs and questions for differentiation
Topics Addressed:
•Drought and Elk Population
•Population of Owls and Mice in a Field
•Predator Prey Graph
•Population Growth Curve Graph
•Wolves and Moose Population
•Seasonal Population of Deer
•The Effect of Invasive Species on Native Species
•Growth Rate of Population
•Survival Rate of Hares
•Biodiversity in Different Biomes
•pH Levels and Survival Rate
Evaluating a Graph
•Number of Species in an Ecosystem
•Average Yearly Precipitation
•Distribution of Organisms
•Energy Pyramid
•Food Web
•Biodiversity of a Pond
•Weight of Freshwater Fish
•Consumption of Grass (Resource Availability)
For NGSS MS LS2-1
Analyze and interpret data to provide evidence for the effects of resource availability on organisms and populations of organisms in an ecosystem.
•No prep pages (printable and Google Slides)
•Addresses the standard on Resource Availability and Data LS2-1
•Great practice for Testing
I love to read your feedback. Please leave a comment to earn TPT credits!
Please follow me on TPT for updates when I post a new product. Save money on my new resources, 50% off for the first 24 hours!
You might also like:
Interactions in the Ecosystems


