
3rd Grade Making & Interpreting Picture Graphs or Pictographs Google Worksheets


Games 4 Gains
30.6k Followers
Grade Levels
3rd
Subjects
Resource Type
Standards
CCSS3.MD.B.3
Formats Included
- PDF
- Google Apps™
Pages
20 practice slides, answer key
Games 4 Gains
30.6k Followers

Includes Google Apps™
The Teacher-Author indicated this resource includes assets from Google Workspace (e.g. docs, slides, etc.).
What educators are saying
I have a student who has a lot of difficulty with fine motor skills, so I modify everything to be on the computer for him. This was so great because it was already done for me, and he really liked it!
I am so happy I found this resource! My students absolutely LOVE it! So engaging and fun! Thank you so much!
Also included in
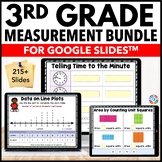 Make practice and review fun with the interactive activities in this huge 3rd Grade Measurement and Data Digital Worksheets Bundle. With over 200 slides included for all 3rd grade measurement and data skills (telling time, elapsed time, mass & volume, bar graphs, line plots, area & perimeterPrice $35.99Original Price $41.80Save $5.81
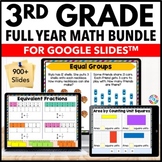 Make your 3rd grade math worksheets interactive with these digital math review packets for Google Slides™. This huge bundle of 3rd grade math review covers all key 3rd grade math standards for place value, operations, fractions, measurement, data, geometry, and word problems. With over 900 slides inPrice $109.50Original Price $137.30Save $27.80
Description
Google Paperless Practice - 3rd Grade Make & Interpret Picture Graphs {3.MD.3}
Engage your students with this interactive DIGITAL resource that works with Google Slides™. No more copies to be made, no more printer ink, and no more lost papers!
With this 20-slide digital resource, your students will practice making picture graphs and interpreting data on picture graphs. Students will love interacting with the movable pieces and typing their responses on these slides!
This resource was created to support 3rd grade Common Core standard 3.MD.3: Draw a scaled picture graph and a scaled bar graph to represent a data set with several categories. Solve one- and two-step "how many more" and "how many less" problems using information presented in scaled bar graphs.
Note: This resource does not include bar graphs. That resource can be found here:
3rd Grade Bar Graphs Digital Practice {3.MD.3}
When you purchase this DIGITAL resource, you'll receive:
• Instructions for opening, sharing, and using this Google Slides™ file
• 20 interactive slides for your students to complete
• Teacher answer key
If you have a Google classroom, this activity is sure to make practicing these key skills way more fun than if they were done with paper and pencil.
Want to learn more? Click on the green "Preview" button above!
IMPORTANT: This is a digital resource, so please only purchase this resource if you have the capabilities in your classroom to use it (computers, laptops, or tablets, Internet access, and a Google account).
If you have any issues with this resource, please feel free to email me directly at brittney@games4gains.com. I'll be happy to try to help you!
Looking for more digital resources that cover 3rd grade skills?
3rd Grade Bar Graphs Digital Practice {3.MD.3}
3rd Grade Measure Lengths to the Nearest Half and Quarter Inch {3.MD.4} Digital Practice
3rd Grade Line Plots with Fractions & Whole Numbers {3.MD.4} Digital Practice
3rd Grade Area of Rectangles {3.MD.5, 3.MD.6, 3.MD.7} Digital Practice
3rd Grade Area as Additive & Distributive Property {3.MD.7C, 3.MD.7D} Digital Practice
3rd Grade Perimeter of Polygons Digital Practice {3.MD.8}
Want to see all of the digital resources that we have available?
Check out our 3rd Grade Digital Resources, 4th Grade Digital Resources, and 5th Grade Digital Resources!
~~~~~~~~~
Your students may also enjoy these 3rd grade measurement & data activities from Games 4 Gains:
3rd Grade Measurement & Data Games Pack - BEST SELLER!
3rd Grade Measurement & Data Board Games Bundle
Bar Graphs Board Game
Line Plots Board Game
Picture Graphs Board Game
Measuring Lengths Board Game
Perimeter Board Game
Area Board Game
Measuring Mass and Volume Board Game
Elapsed Time Within An Hour "Squares" Games
~~~~~~~~~
Customer Tips:
We love to hear what you think! Please leave your feedback on this resource to earn credit points to save money on future purchases!
Click on the green ★ above to follow my store to get notifications of new resources, sales, and freebies!
Connect with me on social!
Newsletter • Blog • Pinterest • Facebook • Instagram
~~~~~~~~~
Created by Brittney Field, © Games 4 Gains, LLC.
This purchase is for single classroom use only. Sharing this resource with multiple teachers, an entire school, or an entire school system is strictly forbidden. Multiple licenses are available at a discount.
This work is licensed under a Creative Commons Attribution-NonCommercial-NoDerivatives 4.0 International License.
Total Pages
20 practice slides, answer key
Answer Key
Included
Teaching Duration
N/A
Report this resource to TPT
Reported resources will be reviewed by our team. Report this resource to let us know if this resource violates TPT’s content guidelines.
Standards
to see state-specific standards (only available in the US).
CCSS3.MD.B.3
Draw a scaled picture graph and a scaled bar graph to represent a data set with several categories. Solve one- and two-step “how many more” and “how many less” problems using information presented in scaled bar graphs. For example, draw a bar graph in which each square in the bar graph might represent 5 pets.
Reviews
Questions & Answers
30.6k Followers
